What do your customers value most? Whether your answer is value for money and/or quality of service, the three Baltic power TSOs mastered both. Power Transmission System Operators are obliged under specific European Union Directives to publish certain market data on the ENTSO-E Transparency Platform, as well as additional data - if required - by the national regulator. Market participants can find further useful information on market organizers and/or exchange websites as is standard in Europe. However, Estonian Elering, Latvian AST and Lithuanian Litgrid went one step further.
They jointly created and have now updated the Baltic Transparency Dashboard (BTD), which provides a unique single source of all compulsory and voluntary data publications on the Baltic power markets. Thus, the operators deliver a stakeholder experience exclusive and unknown in most of Europe. Those who are active on the power market know the pain of collecting data from different sources very well. Some data is available on the Transparency Platform, some on Nord Pool or EPEX websites, and some only on a TSO website or tucked away in the annual reports of the National Regulatory Authority. Stakeholders in the three Baltic markets no longer have to deal with this challenge.
We at Navitasoft, together with the web development experts at Integral Vision, delivered a new architecture and visualization of the Baltic Transparency Platform to further improve user experience thanks to a robust platform design and an even more ergonomic layout. We have previously collaborated with Elering on other projects, but it was the first time with Kristofer Vare, Analyst at the System Services Unit of the Estonian TSO. “I was very curious to work with Navitasoft’s implementation team,” he said, “and I am really pleased with the deliverables.” Edijs Erdmanis, IT Project Manager at Latvia’s AS Augstprieguma tikls, was similarly enthusiastic:
“Navitasoft came on board with a very clear vision of how to manage an agile Scrum project with three legal entities on the customer side. Clearly, they had had experience handling such a multi-stakeholder constellation, and their project management methodology ensured getting the necessary input, as well as the desired results, on time. Seeing how smoothly the project progressed and how easily all contract conditions were fulfilled was quite thrilling.”
The wealth of knowledge and experience both our company and Integral Vision have gained over the years helped us understand our partners’ core business and their expectations. Also, the ideal working conditions made it possible for us to provide some additional input which was then taken on board. “In addition to using their innovative technical approach,” Benas Makauskas, Head of Market Services Planning Group at Litgrid, said, “the expert teams of Navitasoft and Integral Vision came up with some excellent ideas, which went a long way toward achieving the desired outcome.”
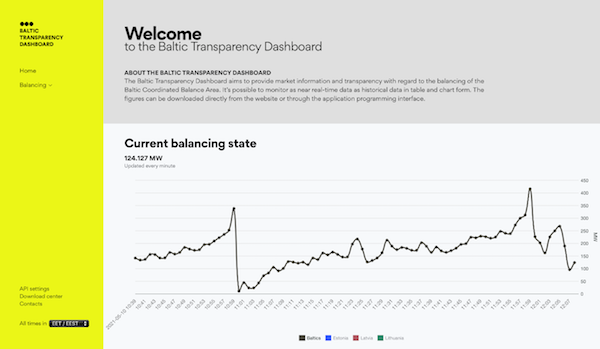
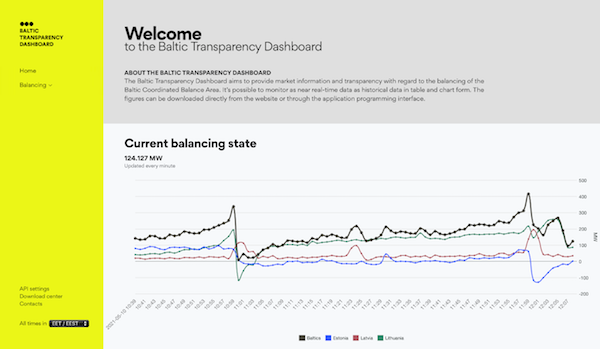
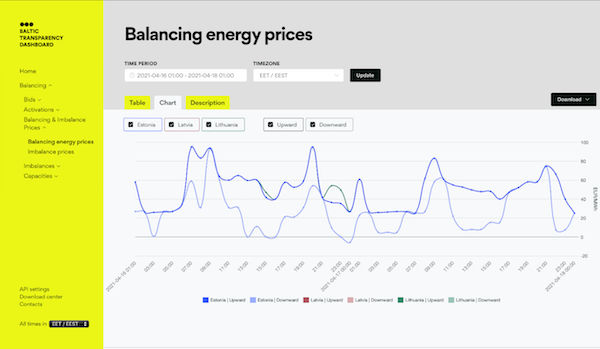
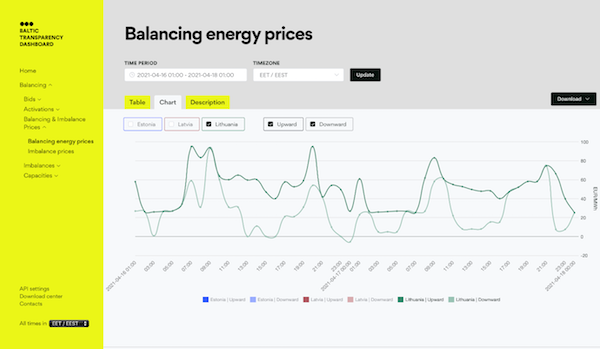
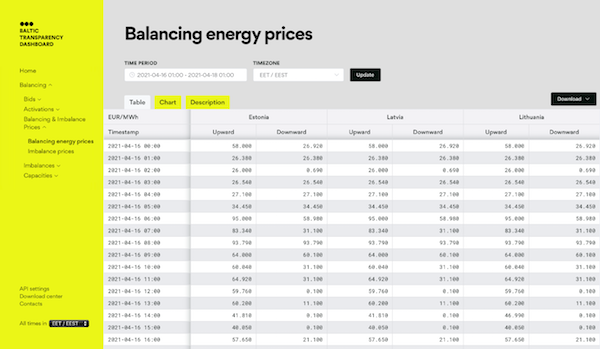
That desired outcome is the redesigned and upgraded Baltic Transparency Dashboard.
The web application has been developed by using decoupled Drupal architecture adopting an API-first approach. This makes it easier for stakeholders who want to automate data consumption, by providing their developers a set of APIs so they don't have to build out an entire stack.
Until recently, companies have mostly used Drupal to build and edit websites. The developers of BTD 2.0 took it even further: the integration capability of the platform means that Drupal can be used as a central repository to manage all of the data.
The main functionality is receiving balancing data from external systems (COBA and Baltic TSOs' balance management systems) via Web Services. The download center offers the opportunity to download data by choosing data entity, file type (.csv, .xlsx,) and time period.
The frontend application is based on popular open source frameworks Nuxt.js and Vue.js, while data visualization was made with the open source library Chart.js. The rich user interface is fully responsive while content syndication was built with a “create once, publish everywhere” approach, using the data repository in Drupal’s backend to serve data to any number of other channels and devices.
It was certainly an exciting venture, and given how successful it was, it’s more than likely that all the companies involved in this project will work together again in the future. Ákos Füzi, CEO of Navitasoft, is certainly optimistic in this regard:
“We were pleased to be part of this innovative project and to see how satisfied our highly valued TSO customers were with the outcome. It can serve as a model for future transparency platforms across Europe. We hope to continue delivering high quality services for stakeholders on the Baltic energy markets and beyond.”
Screenshots